


Effect of bile acid on growth performance and SR of Penaeus vannamei (Ecuador)
Effect of bile acid on growth performance and SR of Penaeus vannamei (Ecuador)
1 Experimental purpose
Feeding experiments were performed by adding bile acids to Penaeus vannamei feed, and detailed data were recorded. Through the analysis of the data, to verify the effect of bile acid on the growth index and survival rate of Penaeus vannamei.
2 Experimental materials
Experimental feed: Nicovita complete feed with special bile acid for shrimp and crab (purity ≧30%), provided by Shandong Longchang Animal Health Products Co., Ltd. Half an hour before feeding, evenly spray the surface of shrimp feed with feed solution containing bile acid. Keep the surface dry in a cool place to allow the bile acid to fully penetrate into the feed.
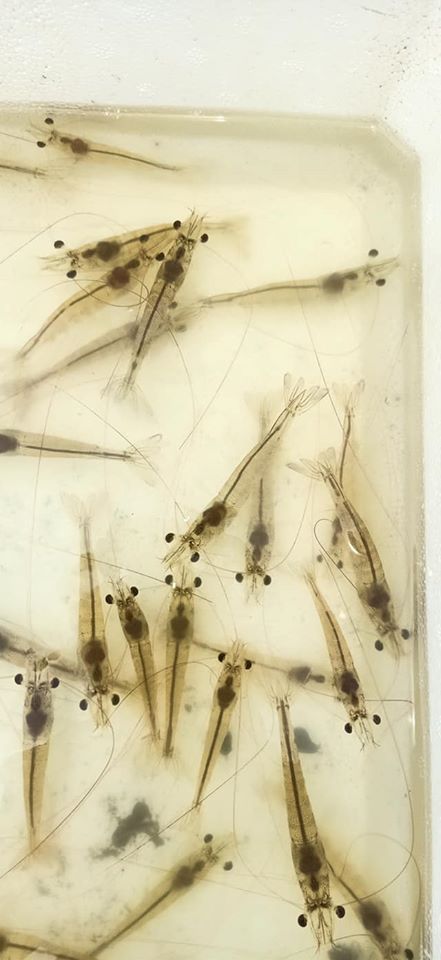
Experimental shrimp: 2 cm
Experimental site: A large aquaculture farm in Machala, Ecuador.
Experimental time: November 15th, 2018 to January 9, 2019, a total of 56 days.
3 Experimental methods
Two groups,5 × 106 tails of P. vannamei were set up for each group. The control group was fed with conventional feed, and the experimental group was supplemented with 1 kg bile acid(special for shrimp and crab) per ton of feed, and fed continuously for 8 weeks. During the experiment, record the feed amount every day, and sample the shrimp randomly every 7 days. Record weight gain and survival rate of the two groups. Keep management conditions same for the two groups of shrimp feeding.
4 Experimental indicators
Average weight of shrimps (gram)
Survival rate (SR, %) = 100 × number of terminal prawns / initial prawns;
Feed conversion ratio (FCR) = feed intake / (total shrimp weight - initial shrimp total weight);
5 Experimental results
5.1 Effect of bile acid on the average body weight of Penaeus vannamei
At 12, 20, 27, 34, 41, 44, 48 and 56 days of age, randomized multi-point sampling (reduction of error) was performed on the two groups of shrimps, weighed and calculated the average body weight. The average body weight data (gram) of the control shrimp at different ages: 0.2, 0.5, 1.4, 2.8, 4.5, 5, 5.7, 7. The average body weight data (gram) of the experimental group at different ages were: 0.2, 0.8, 2, 3.8, 5.5, 6, 7.2, 9; after statistical analysis, with the increase of body weight, at 20 days of age, the average body weight of shrimp in the experimental group was greater than that of the control group; the average body weight of the experimental group was 28.6% higher than that of the control group, which was significantly higher than that of the control group (p < 0.05).
